Harrow Agri: crop vigour across 410,000 hectares
Harrow sells field-level yield forecasts to grain traders. Two multispectral satellites revisit every field every 36 hours, and the vegetation index feeds the forecasting model automatically.
- Customer
- Harrow Agri, grain analytics
- Sensor
- Multispectral, 5 m
- Fleet
- 2 satellites
- Area
- 410,000 ha, irrigated high plains
- Live since
- March 2023
The problem
Grain traders pay for yield forecasts that arrive before the official crop reports. Harrow's model needs a clean vegetation reading of every field every few days, through the whole growing season.
Free satellite data gave them one clear view of a given field about every ten days, with different calibration between sources. Cloud decided which weeks the model could use, and the traders noticed the gaps.
The setup
Harrow supplied their field boundaries. We built the standing schedule around them, so no request is needed day to day: the satellites image the area, the pipeline cuts scenes to field polygons, and the model reads statistics rather than pixels.
| Payload | 2 multispectral satellites (PH-M), same plane, 10:30 overpass |
|---|---|
| Area | 410,000 ha across four irrigated counties, a standing weekly schedule |
| Revisit | Every field every 36 hours on average |
| Products | L2A surface reflectance and NDVI, field polygons as GeoParquet |
| Delivery | Pushed to Harrow's AWS bucket, STAC item per scene, webhook to the model queue |
| Term | 3 years, renewed for 5 in 2025 |
What the satellites saw
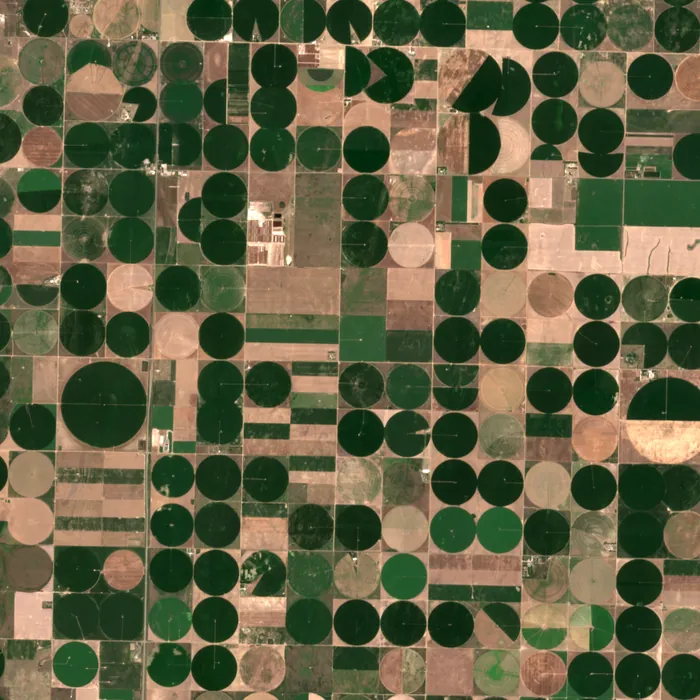
Imagery: Contains modified Copernicus Sentinel data (2025), Sentinel-2.
Results
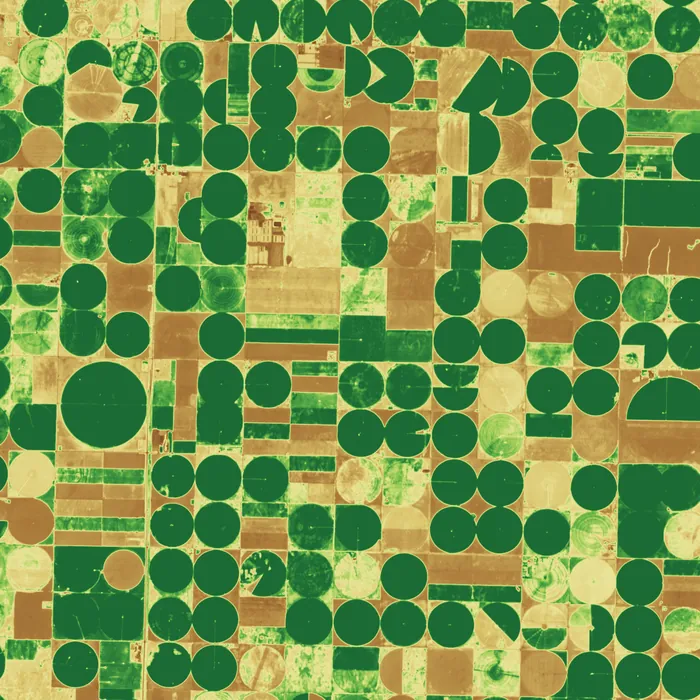
The four panels show one square of the area through the season. Wheat is green in May, harvested by mid-June; corn rises through July and starts to senesce in August. The model watches each circle separately.
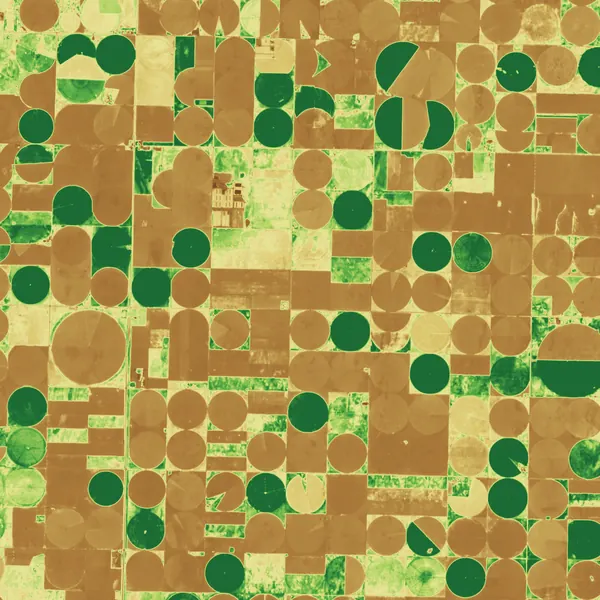
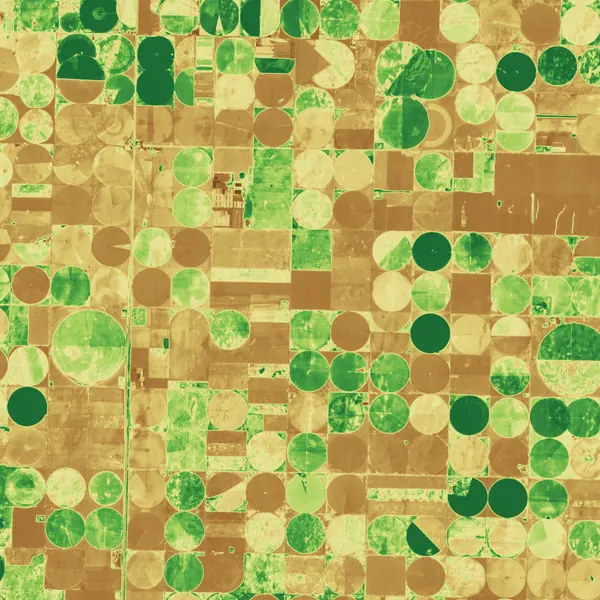
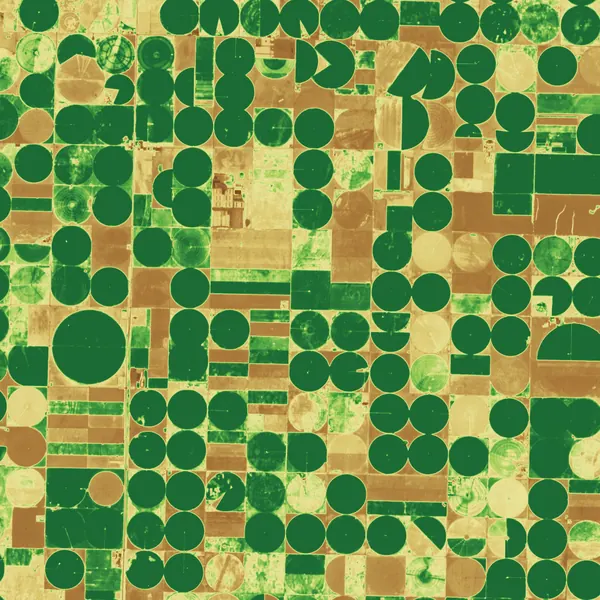
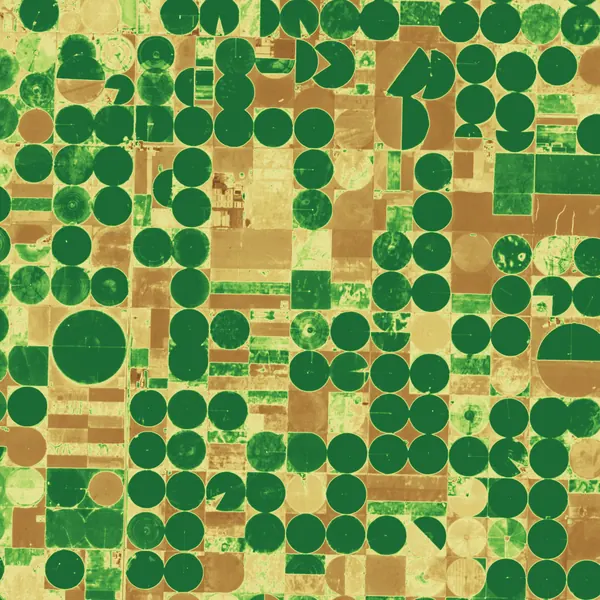
Imagery: Contains modified Copernicus Sentinel data (2025), Sentinel-2, southwest Kansas.
- Revisit
- 36 h
- Forecast error by mid-July
- 3.8%
- Delivery to model
- 11 min
- Fields monitored
- 6,900
| Before | One usable image per field about every 10 days; 4 sources, 4 calibrations |
|---|---|
| After | Every field every 36 hours; one calibration chain; same-day model refresh |
| Model input lag | Down from 6 days to under 3 hours |
| Analyst time on data preparation | Down from two people to a script |
Our model used to wait for cloud. Now it waits for the crop.
Customer, quotes and figures are invented for this concept site.
Could this work for your area?
Send us the region and the question; we will tell you which sensor and fleet size it takes.